Since I suck at math I thought I could make myself a tool to help me visualize it and see relations between numbers, practice some very useful math stuff needed for game development and such.
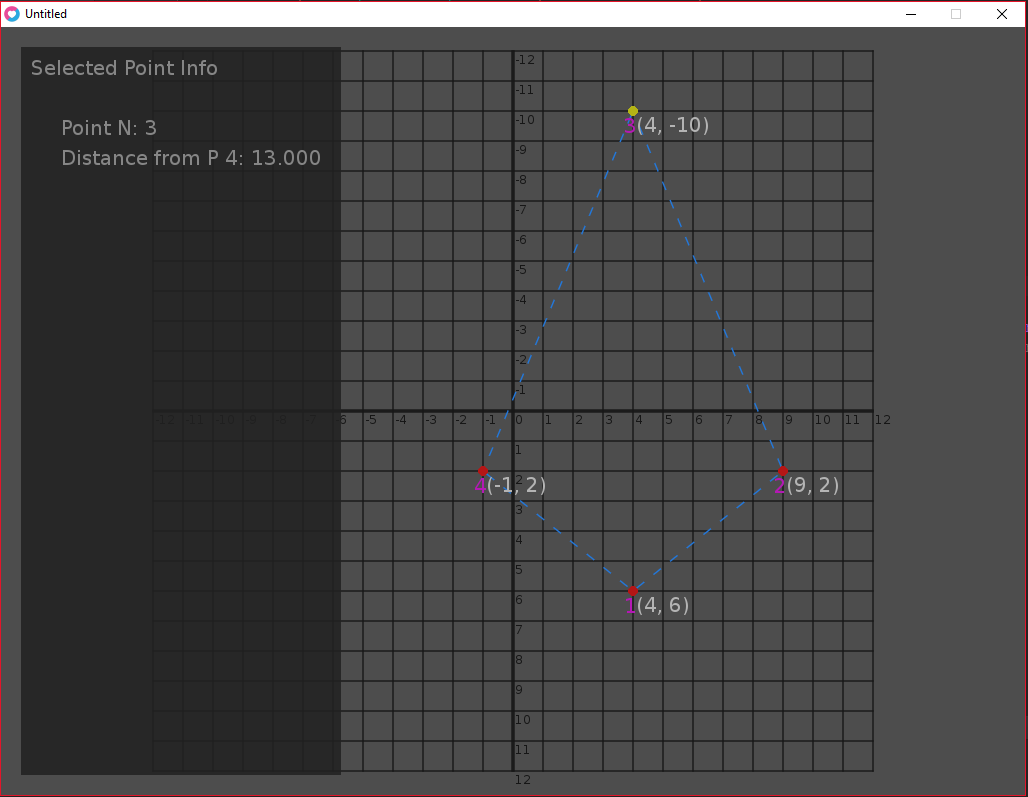
So I started today trying to visualize the distance formula x^2 + y^2 = c^2
Program below, feel free to try and break it
keys:
left mouse button press = add point to the grid
left mouse button drag = drag around selected point
numpad+ = zoom (enlarge) the grid
numpad- = zoom (shrinken) the grid
F1 = switch between fullscreen and windowed
After adding a second point, the next point you select will display the distance from the next point in the info pannel on the right
Simple math practice
- Marcus Aseth
- Prole
- Posts: 14
- Joined: Wed Apr 05, 2017 11:56 am
Re: Simple math practice
I was trying to add a dashed line and I got this (img below)
This is the code (code below)
There is any easy way for me to add a moving animation to the dashes in that code? Like if they are flowing from one point to the next
(the points passed to this function are ordered by index, and when the last index is the starting point the end point is index 1, it goes in a circle)
Code: Select all
function dashedLine(startX, startY, endX, endY)
--dashed line segments dinamically increased based on the 2 points distance
local lineDivisions = 1.5 * round(findDistance({ x = startX, y = startY }, { x = endX, y = endY }))
--split the distance between the 2 points into N segments, distX/distY are 1 segment lenght
local distX = math.abs(endX - startX) / lineDivisions
local distY = math.abs(endY - startY) / lineDivisions
--set on which direction the segment should go
distX = startX < endX and distX or -distX
distY = startY < endY and distY or -distY
--offset to center the dashed line (not truly working though)
local offsetX = (startX + distX / 4)
local offsetY = (startY + distY / 4)
for i = 0, lineDivisions - 1 do
local currX = offsetX + distX * i
local currY = offsetY + distY * i
local nextX = currX + distX / 2.5
local nextY = currY + distY / 2.5
love.graphics.line(currX, currY, nextX, nextY)
end
end
- OnACoffeeBreak
- Prole
- Posts: 28
- Joined: Tue Apr 11, 2017 11:19 am
Re: Simple math practice
I'm new to LOVE myself... I think it's neat to use it to visualize trigonometric problems, and I really like how your demo looks and feels.
If I understand correctly, you're using the Pythagorean theorem to calculate the distance between two points. I wonder if it would help to present an interactive visual proof of the theorem. Maybe one of these will work:
https://math.stackexchange.com/question ... as-theorem
https://math.stackexchange.com/question ... an-theorem
https://math.stackexchange.com/question ... m-you-know
Re: Simple math practice
One fantastic thing about math is that you don't need to intrinsically understand it or know what representations it has, you just need to know how it works and do equations right. Things like quaternions and matrices and whatnot.
Who is online
Users browsing this forum: Semrush [Bot] and 2 guests