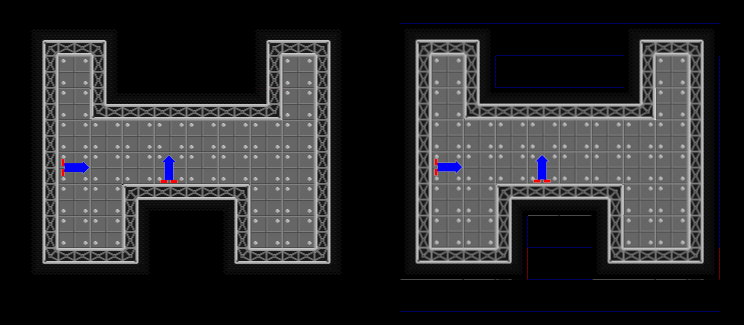
It's probably best illustrated with the tile sheet and map screens. The left map image is how it should look, the right map image is how it does look after moving the tiles a bit. The bleed from the red and blue tiles on the map (where they aren't in use) is clearly visible near the tiles adjacent to them on the tile sheet .


I'm drawing the tiles with data from a table that stores an image reference to the spritesheet and a quad to extract the tile indexed the x/y coordinates of each tile plus an offset (cxmin/cymin) from the camera. cxmin/cymin are usually not integers.
Code: Select all
love.graphics.drawq( map.atlas[map.tile[layer[x][y]].img], map.tile[layer[x][y]].quad, x*map.data.tilewidth-cxmin, y*map.data.tileheight-cymin )
-- stands for:
love.graphics.drawq( [spritesheet], [tile quad], xposition+xoffset, yposition+yoffset )Speaking of sprite sheets, is there a noticeable performance difference in using quads to access a texture atlas in contrast to extracting the sprite from the raw data and storing them individually at runtime?