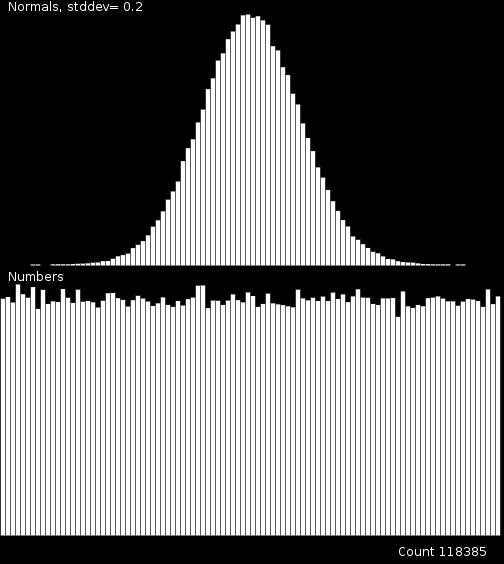
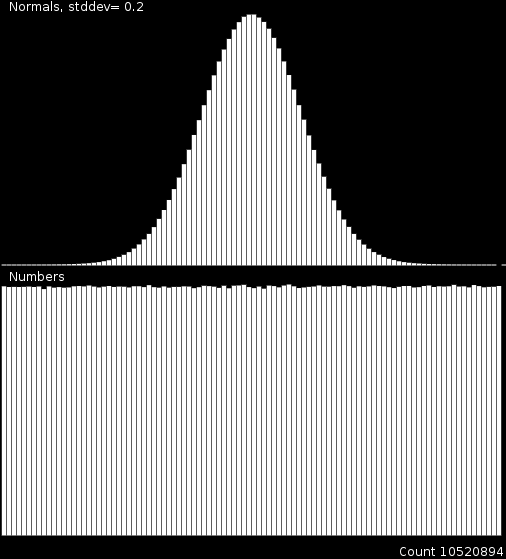
Here is the results (from a previous revision):
(small sample set):

(large sample set):

Feel free to use this code to play around with it yourself. First four lines are options for you to choose from. Its binned into Size bins. The first and last may contain overflow from the normal distribution depending on your StdDev and Size because I clamp out of range values (rather than discard).
Code: Select all
Seed = 2024561111
StdDev = 10
NumbersPerSecond = 1000000
Size = 100

rndNormals = {}
rndNumbers = {}
count = 0

function love.load()
  rndGNormal = love.math.newRandomGenerator(Seed)
  rndGNumbers = love.math.newRandomGenerator(Seed)
  for i=0,Size do
    rndNormals[i] = 0
    rndNumbers[i] = 0
  end
end

function love.update(dt)
  local numcount = NumbersPerSecond*dt
  for i=1,numcount do
    local na,nb = rndGNormal:randomNormal(StdDev,Size/2),rndGNumbers:random(Size)
    local norm = math.max(math.min(math.floor(na),Size),0)
    local numb = math.max(math.min(math.floor(nb),Size),0)
    rndNormals[norm] = rndNormals[norm]+1
    rndNumbers[numb] = rndNumbers[numb]+1
  end
  count = math.floor(count + numcount)
end

function drawGraph(g,ox,oy,height)
  love.graphics.setLineWidth(4)
  local max = math.max(unpack(g))
  for i=0,#g do
    local x = 5*(i-1) + ox
    local y = oy+height
    local lh = height*(g[i]/max)
    love.graphics.line(x,y,x,y-lh)
  end
end

function love.draw()
  love.graphics.print("Normal Random, stddev= "..tostring(StdDev).." size= "..tostring(Size),10,0)
  drawGraph(rndNormals,10,15,250)
  love.graphics.print("Default Random",10,270)
  drawGraph(rndNumbers,10,285,250)
  love.graphics.print("Count "..tostring(count),400,285+250+10)
end