PROBE.lua: realtime graphical profiler

Showcase your libraries, tools and other projects that help your fellow love users.
Post Reply
User avatar
Chèvre
Prole
Posts: 16
Joined: Sun Sep 16, 2012 4:53 pm
Location: France

PROBE.lua: realtime graphical profiler

Post by Chèvre »

Is your game running slow?
Have you ever wished you could profile rabidly obnoxious bottlenecks effortlessly?
Well then PROBE.lua is for you!

I hope you'll find it useful! If not, it was fun to write.
I'm open to comments/suggestions/feature requests/bug reports/you name it!

Source: https://github.com/jorio/PROBE
Demo: see attachments

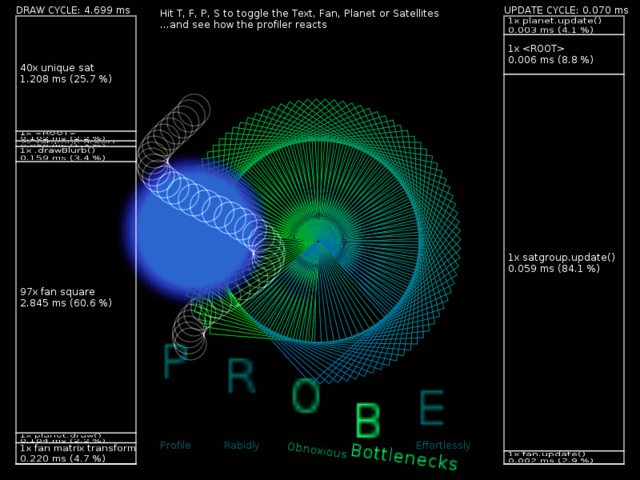
Screenshot of the demo below. The actual profiler is the two bars on the sides; the colored junk in the middle is what's being profiled.

Latest update 2014-08-22

2014-08-22: pause/resume on the fly (PROBE.enable()), preserve return values of hooked functions (thanks for the heads-up lemtzas)
2014-08-03: first version

Image
Attachments
probedemo2.love
updated 2014-08-22
(5.67 KiB) Downloaded 243 times
Last edited by Chèvre on Fri Aug 22, 2014 2:00 pm, edited 1 time in total.
User avatar
Ragzouken
Citizen
Posts: 84
Joined: Fri Aug 10, 2012 7:59 am
Contact:

Re: PROBE.lua: realtime graphical profiler

Post by Ragzouken »

this is amazing!

i suggest you do whatever you can to make this auto-detect the settings: "GPROFILER:hookAll(_G, "draw", {love, lg})" i don't really know what this means, but do i need to know? what if "GPROFILE:hookAll("draw")" did the rest by default?

also it'd be nice if you could make it auto-detect the screen size and you could just do something like: probe.draw(CPROFILE, GPROFILE, ...) and it would draw the columns without you specifying coordinates

these are all usability suggestions, the library itself is very impressive and i'm using it immediately
User avatar
Chèvre
Prole
Posts: 16
Joined: Sun Sep 16, 2012 4:53 pm
Location: France

Re: PROBE.lua: realtime graphical profiler

Post by Chèvre »

Hi! Thanks for the feedback! You're right, placing hooks automatically isn't the most intuitive thing in the world. I should write a tutorial and/or provide a sensible mass-hook default function.

But the gist of it is:
  1. create a new profiler
  2. surround code that you would like to profile with profiler:startCycle() and profiler:endCycle() (typically in love.draw() or love.update())
  3. create "events" for which you'd like to have detailed statistics
If you don't create custom events, everybody's runtime will be lumped together in a default event named "<ROOT>". Fortunately, it's easy to create events automatically by placing hooks onto functions that do important things, typically your draw() or update() functions. To create events from functions, you can either:
  1. hook each individual function by hand
  2. mass-hook a ton of functions that have the same name
A. is tedious for "real world" projects; it's only really useful to profile one-off functions that have a unique name. But it's done as such, assuming Missile, Enemy, Player are tables (e.g. classes):

Code: Select all

profiler:hook(Missile, 'draw', 'draw a missile')
profiler:hook(Enemy, 'draw', 'draw an enemy')
profiler:hook(Player, 'draw', 'draw myself')
Now for B., assuming Missile/Enemy/Player are global tables, you can do this instead:

Code: Select all

profiler:hookAll(_G, 'draw', {love})
This will look in all subtables of _G (in Lua, _G is the table of all globals) for functions named 'draw' and place a profiling hook on it. In other words, it'll match:
_G.Enemy.draw
_G.Missile.draw
_G.Player.draw
_G.love.draw
Oops! We don't want to place an automatic hook on love.draw(). That's why we give hookAll a list of tables to skip, in this case just {love}.

(Technical reason why you don't want to place a hook on love.draw(): hooks actually just wrap a function call in an event; events may only occur in a "profiling cycle"; but you start and end the cycles in love.draw(), so if an event is triggered before a cycle exists, the profiler will crash)

Similarly, in the little example posted on github, I've also told the profiler to ignore lg. I used "lg" as an alias for "love.graphics". Since I don't want the profiler to place a hook on love.graphics.draw (through lg.draw), I told it to ignore lg.

Note that while it is dangerous to profile love.draw, it's totally okay to profile love.graphics.draw (that's the one that draws images). You can even profile LÖVE itself, e.g. love.graphics.rectangle, love.graphics.print, etc.

So I've mainly talked about hooks on functions here, but you can also create little events in your code with pushEvent()/popEvent() (it's really simple). I recommend reading main.lua from the demo because it explores all possible use cases. Also, don't hesitate to read the comments in PROBE.lua, they also describe how you should call each function.

While writing this post, I've realized the API could be made more intuitive, and I'll think of ways to simplify interaction with the hook mechanism. I should also post tutorials/luadocs somewhere :) Thankfully, you only need place hooks once (typically in love.load()) and then you don't have to touch them again, so if you'd like to use the profiler right away, you don't really *need* to understand the hook conundrum in-depth. But I'm really glad it's useful to you!
User avatar
Ragzouken
Citizen
Posts: 84
Joined: Fri Aug 10, 2012 7:59 am
Contact:

Re: PROBE.lua: realtime graphical profiler

Post by Ragzouken »

thanks for explaining that, it really helps. i didn't have a lot of my classes imported into main.lua, which meant it didn't automatically profile everything with the example line - so i was confused by that. this is really great
lemtzas
Prole
Posts: 1
Joined: Mon Aug 11, 2014 3:19 am

Re: PROBE.lua: realtime graphical profiler

Post by lemtzas »

Thanks! I found this really useful for tracking down bottlenecks in my game.

I had to make a modification though (functions that return values wouldn't profile correctly, so I packed, stored, unpacked, and returned the results).

A couple other features I'd like (or will probably make on my own eventually) are clearing all tracked functions and/or telling it to not worry about running a function without starting a cycle and/or the ability to toggle tracking. So I can quickly add/remove it without it getting too uppity when functions get called outside the segment i'm actually tracking.
User avatar
Chèvre
Prole
Posts: 16
Joined: Sun Sep 16, 2012 4:53 pm
Location: France

Re: PROBE.lua: realtime graphical profiler

Post by Chèvre »

lemtzas wrote:Thanks! I found this really useful for tracking down bottlenecks in my game.
Hi! Great! Thank you for giving it a try!
Sorry about the delay. Reply notifications were turned off :oops:
lemtzas wrote:I had to make a modification though (functions that return values wouldn't profile correctly, so I packed, stored, unpacked, and returned the results).
Whoops! Nice find. I should've thought about this. I've updated it.
lemtzas wrote:A couple other features I'd like (or will probably make on my own eventually) are clearing all tracked functions and/or telling it to not worry about running a function without starting a cycle and/or the ability to toggle tracking. So I can quickly add/remove it without it getting too uppity when functions get called outside the segment i'm actually tracking.
You can try unhook().
I've also added an "enable()" function that lets you pause/resume profiling at any time. Check out the updated demo in the thread's top message.
Btw, don't hesitate to send pull requests for any changes you make ;)
Post Reply

Who is online

Users browsing this forum: SiENcE and 3 guests